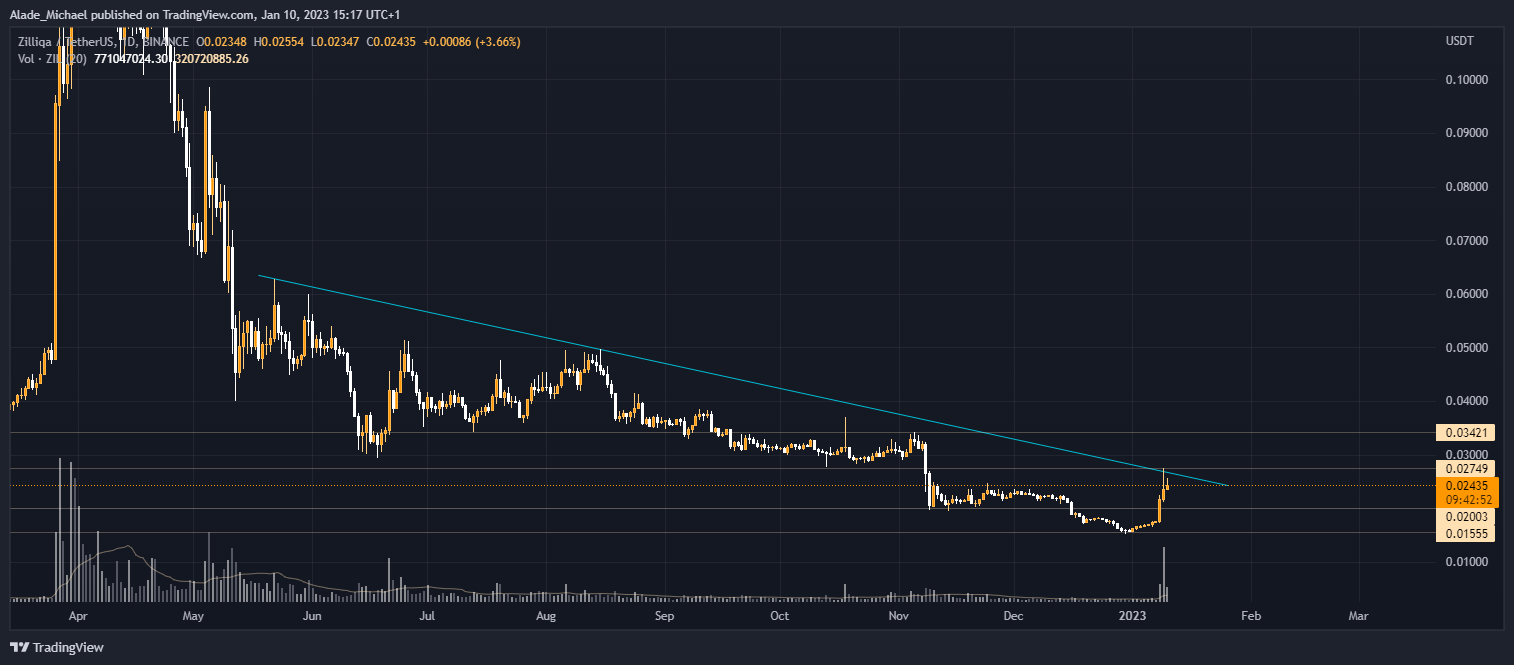
Zilliqa painted a lot of greens over the past few days following a huge recovery from $0.0155. Yesterday, it tested a key resistance and paused the rally after a significant increase.
Even though Zilliqa has registered over 60% gains since the beginning of this month, it is not enough to be considered a bull run. The short-term increase is technically a recovery from the late 2022 crash.
As shown on the chart, the price is now dropping after marking a weekly high at $0.0275. This rejection reveals a sign of weakness from the bull’s side, which could cause a downward spiral if they fail to act upon the provided discount.
It is important to note that ZIL still looks bearish on a long-term scale. Though it may appear to have found local support above $0.015. This support is not confirmed yet. It would need to establish a subsequent one around it before we can consider a change in trend.
Another thing to consider for this long-term decline is the consistent rejection at the descending trend line, which has been acting as dynamic resistance for months. We can see that this same pattern is playing out with the recent retracement movement.
However, if the ZIL/USDT pair drives higher and successfully flips this trend line after a potential pullback, we should expect a huge upward movement. It may tap $0.06 on a short-term rally.
For now, the trend remains bearish in the daily chart below.
ZIL Key Level To Watch Out For

Zilliqa’s price is still at the moment. It could post more gains and retake the previous rejection level in the coming days.
Given this, the resistance level to watch above it is $0.034. The higher level is then followed by $0.04.
Meanwhile, the buying pressure looks weak over the last 24 hours. If the price further drops below the $0.02 mark, it may roll back to $0.0155. The target level for a breakdown is $0.001.
Key Resistance Levels: $0.0275, $0.034, $0.6
Key Support Levels: $0.02, $0.0155, $0.01
- Spot Price: $0.0244
- Trend: Bullish
- Volatility: High
Disclosure: This is not trading or investment advice. Always do your research before buying any cryptocurrency or investing in any services.
Follow us on Twitter @nulltxnews to stay updated with the latest Crypto, NFT, AI, Cybersecurity, Distributed Computing, and Metaverse news!
Image Source: karnoff/123RF / Image Effects by Colorcinch


