Several meme tokens have recovered briefly from their dip over the last 72 hours as the market cap evaporated above $14 billion. Behind Doge and Shib, Pepe has charted over 30% gains in the last 7 days.
After testing the low of $0.00000061 in the mid-month, Pepe’s bears took a break from a two-month bearish and bounced slightly from that low.
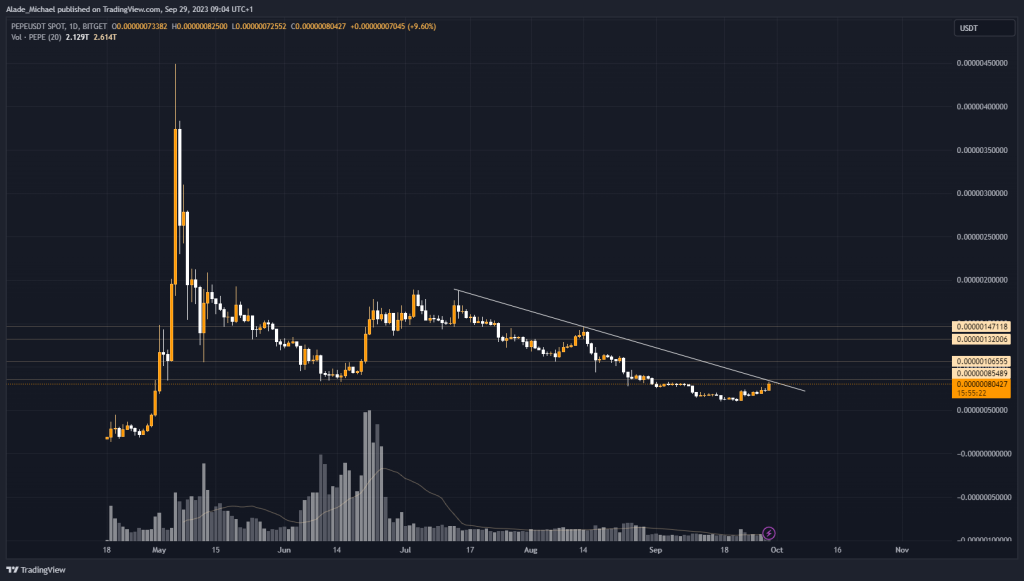
This recovery saw the price retraced to the descending resistance line, drawn on the daily chart below. Unfortunately, the buying paused as it retested June’s low of $0.000000825 today. A clear break above this resistance line could trigger a mini rally for the meme token in the coming days.
But if this resistance line prevents further buying as happened on August 14, Pepe may resume selling in no time. As Bitcoin remains the main driver of the market, this setup may come into play if the price nosedives.
However, looking at the volume indicator on the daily chart, Pepe is still trading flat since the price fell from the $0.000000189 level in July. This suggests massive money outflow. Up till now, there are no signs of increase despite bouncing off the monthly low.
As long as the global crypto market cap continues to see an inflow, the price of Pepe and other meme tokens is most likely to jerk up to tap a new monthly high. For now, the price is under the bear’s radar.
Pepe’s Key Levels To Watch

A break above $0.000000855, which coincides with the descending resistance line could push the price to $0.00000106, $0.00000132 and $0.00000147 from a short-term perspective. A higher level to consider for a strong breakout is $0.00000188.
Inversely, the mentioned monthly low would be the bears’ primary target level in case of a drop. The next possible levels to consider for support are $0.0000005 and $0.0000004 if a breakdown occurs.
Key Resistance Levels: $0.00000106, $0.00000132, $0.00000147
Key Support Levels: $0.00000061, $0.0000005, $0.0000004
- Spot Price: $0.00000080
- Trend: Bearish
- Volatility: Low
Disclosure: This is not trading or investment advice. Always do your research before buying any cryptocurrency or investing in any services.
Follow us on Twitter @nulltxnews to stay updated with the latest Crypto, NFT, AI, Cybersecurity, Distributed Computing, and Metaverse news!


