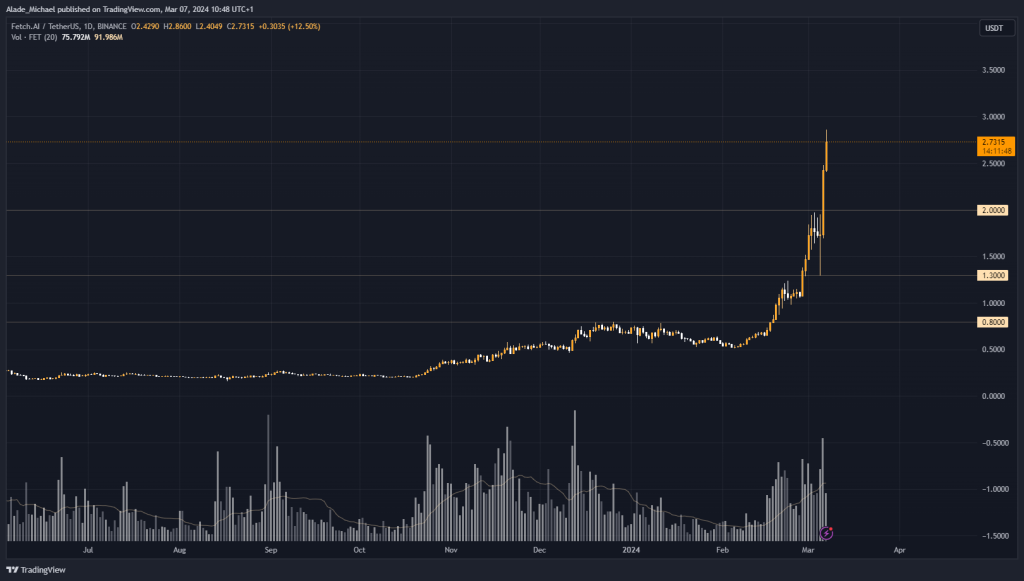
While the past week of trading saw several top meme coins through a big rally, the AI and Data tokens are now gaining traction as Fetch.ai tapped a new high and currently leads the altcoins rally with a 40% surge in the last 24 hours of trading.
FET’s latest bullish rally started in the first week of February after undergoing a correction for six weeks. It found support above the $0.5 level and recovered slowly until the price breakout above the crucial $0.8 level – where it initiated correction last December.
The mid-February breakout triggered a notable rally near the $2 level before facing rejections last weekend. This led to a temporal halt in buying this Monday before dropping suddenly to $1.3 the following day, although it managed to recover speedily to $1.7 that day.
Meanwhile, that sudden drop technically served as a quick retest of the previous all-time high – ATH, which broke during last month’s surge.
As seen on the daily chart, it initiated a fresh buy and flipped through last month’s high to $2.5. The bulls mounted pressure and the price further surged to a daily high of $2.86 – a current ATH.
Looking back to where the price picked up last month, FET has exploded by almost 5x in gains. It has shown no sign of slowing down bullish at the time of writing.
If Bitcoin’s price continues to consolidate on the weekly, we can expect more trading volume to flow into the AI and Data space in the next few days. As of now, there are no signs of the bears in the market.
FET Key Level To Watch

In the latest rally, FET is likely to tap $3. If more buying pressure surfaces in the next few days, the price could reach $3.5 and $4.
The daily support for a drop lies at $2. Lower support levels for deep correction are $1.3 and $0.8, which flipped as resistance last month.
Key Resistance Levels: $3, $3.5, $4
Key Support Levels: $2, $1.3, $0.8
- Spot Price: $2.73
- Trend: Bullish
- Volatility: High
Disclosure: This is not trading or investment advice. Always do your research before buying any cryptocurrency or investing in any services.
Follow us on Twitter @nulltxnews to stay updated with the latest Crypto, NFT, AI, Cybersecurity, Distributed Computing, and Metaverse news!
Image Source: kasza/123RF // Image Effects by Colorcinch


